
Request Analysis
Request Analysis provides period-by-period statistics on service request activity across your managed OMCs — how many requests were opened, how many were closed, average days to close, how many are still open from that period, and total work time logged.
Switch between Monthly and Weekly views to get different levels of granularity. Trend indicators show whether performance is improving or deteriorating over time, making it easy to spot workload spikes and measure the impact of process changes.
List View
Section titled “List View”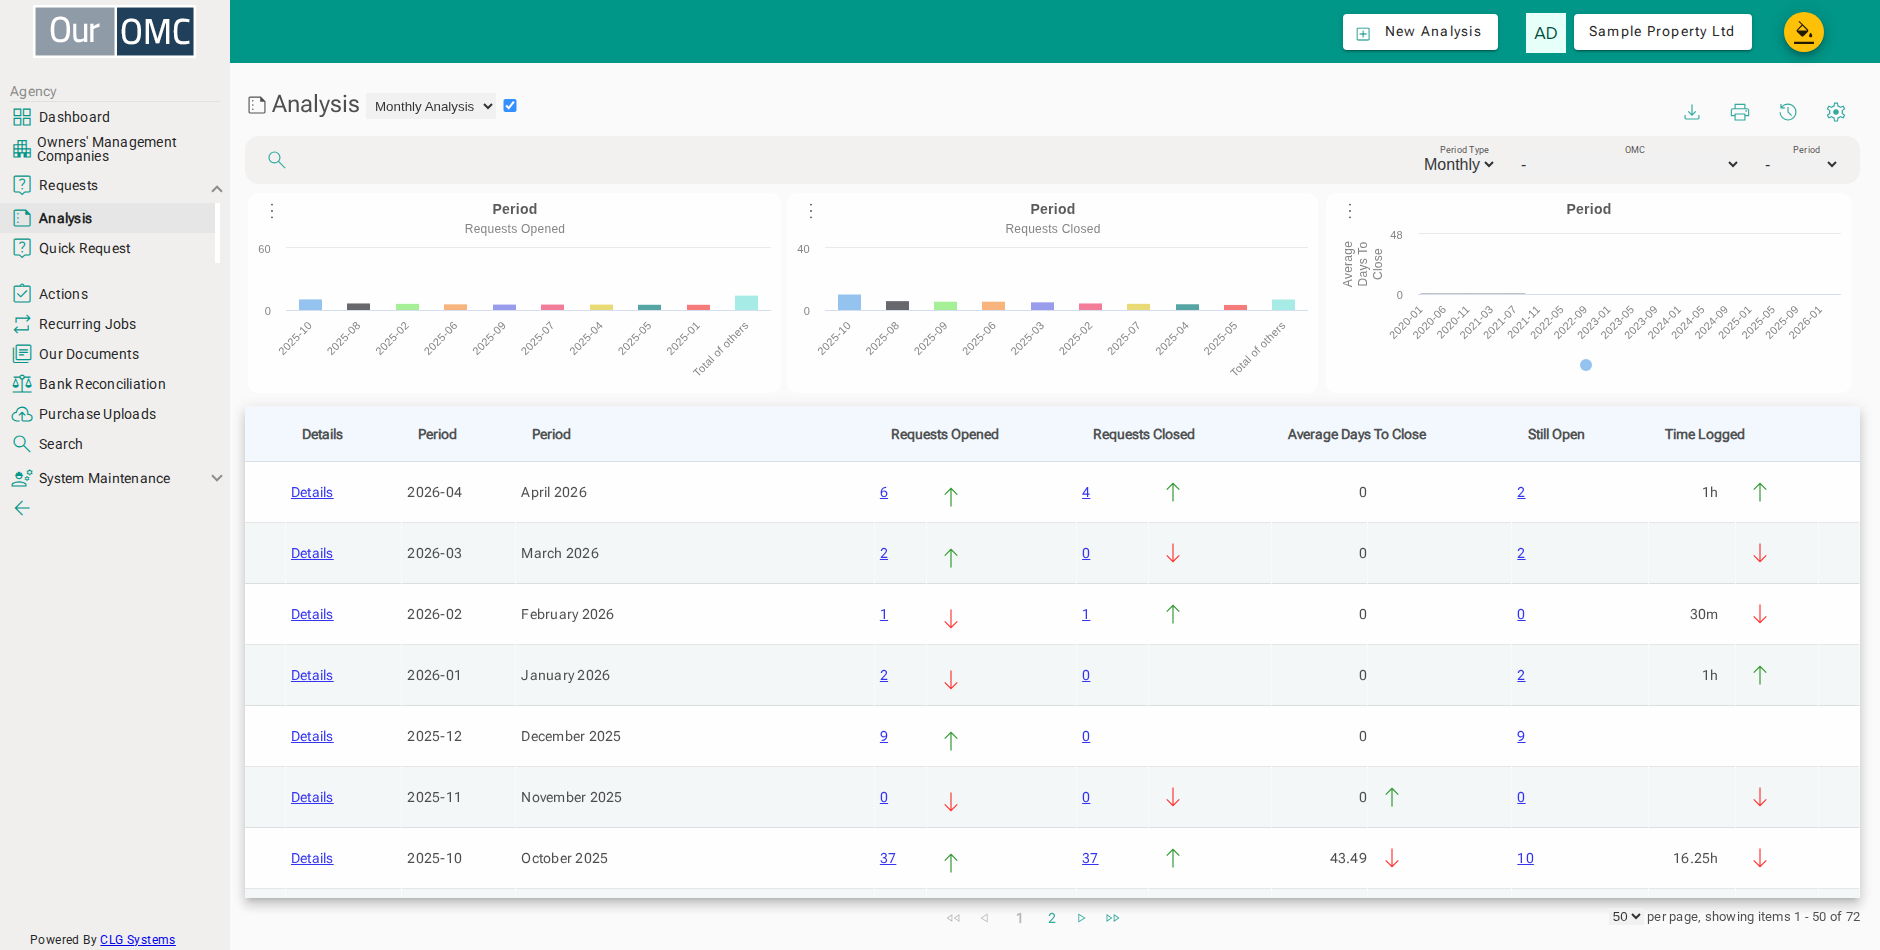
| Column | Type | Description |
|---|---|---|
| OMC | picklist | The OMC this analysis row relates to. |
| Details | link | Link to view the full details for this analysis row. |
| Period | picklist | The reporting period (month or quarter) this row covers. |
| Period | text | A description of the reporting period. |
| Requests Opened | link | The number of requests opened during this period. |
| openedIndicator | icon | A visual indicator showing the trend in requests opened. |
| Requests Closed | link | The number of requests closed during this period. |
| closedIndicator | icon | A visual indicator showing the trend in requests closed. |
| Average Days To Close | number | The average number of days taken to close requests in this period. |
| daysToCloseIndicator | icon | A visual indicator showing whether closure times are improving or deteriorating. |
| Still Open | link | The number of requests that were opened in this period and are still open. |
| Time Logged | number | Total logged work time (in hours) spent on requests in this period. |
| workedIndicator | icon | A visual indicator of the work time trend. |