
The Basics
Most OurOMC pages have the same format. You start by seeing a list view, which contains the data for the page. If you click anywhere in the row on the table, it will take you to the detailed view for that item.
As an example, we will describe the requests page, you can see what it looks like below, but the basic features of most of our pages will look the same as this.
Pages may have views. A view is a standard query that users may find useful, e.g. in this case when you go to requests, by default it shows the users the open requests that they own. There can however be several different views, or lists of this type of item, that you might want to use.
Pages can also have charts, to help analyse the data that is being displayed. The charts are interactive, so you can click on the chart and the data displayed will be filtered accordingly.
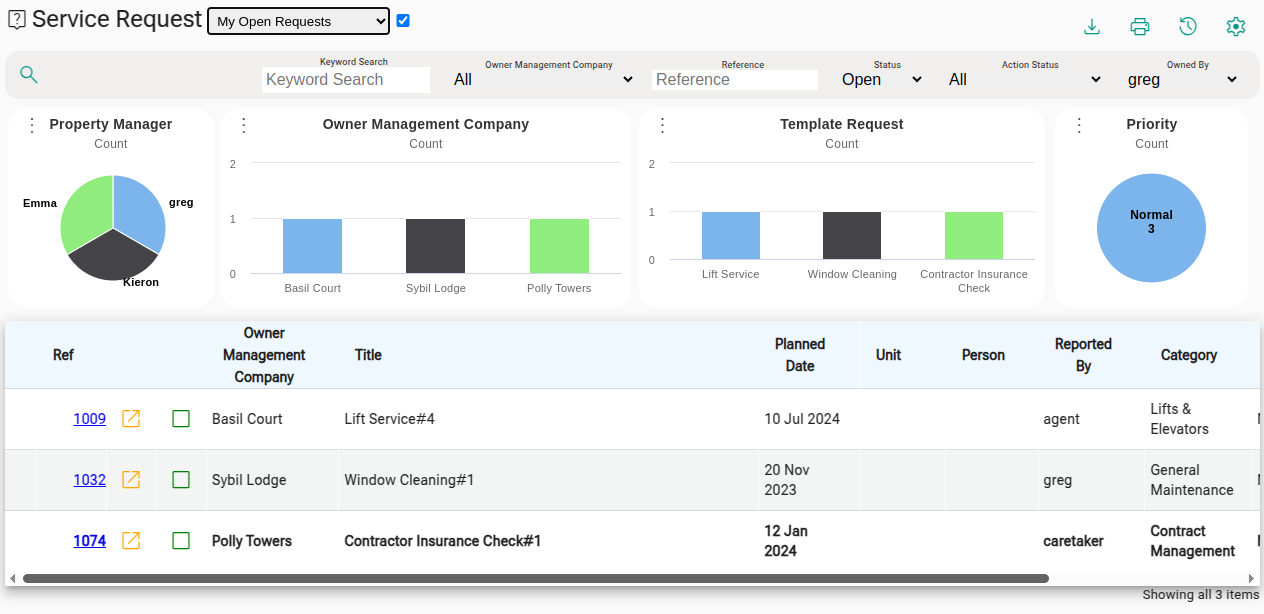
Page Heading Elements
Section titled “Page Heading Elements”Title Bar
Section titled “Title Bar”So to explain what you can see here, starting at the top left corner of the screen
 Is the page icon, also shown on menu, to remind you how to get here
 Is the name of the page you are working on
 Shows the name of your current view of the data.
It is a picklist that allows you to choose between the most common queries people want to make on this data.
Shows the name of your current view of the data.
It is a picklist that allows you to choose between the most common queries people want to make on this data. This checkbox allows you to turn the graphs on or off.
If you are using a small screened device, you may want to turn off the graphs to see more rows in the data table
This checkbox allows you to turn the graphs on or off.
If you are using a small screened device, you may want to turn off the graphs to see more rows in the data table
Page Tools
Section titled “Page Tools”These are the icons in the top right corner of every page.
- help_outline Help button — when this icon is glowing, it means there is documentation available for this page that you have not yet read. Click it to open the relevant guide in a new tab. Right-click the icon for options to stop the highlight on all pages, or to reset your read history so pages you have already visited start glowing again.
- download Download button — allows you to download the data. You can choose CSV format, which exports the currently visible columns in a format easy to import into spreadsheets. For more technical users, JSON format gives full details of everything in the current list. You can choose which columns are included using the settings button.
- print Print button — reformats the page for printing (removing the sidebar menu etc.) and opens the standard browser print dialog, so you can print to paper or save as a PDF to share with others. You can choose which columns are printed using the settings button.
- history History button — where available, shows the audit history for the current item: who created it, when, and what changes have been made since.
- settings Settings button — lets you choose which columns are displayed and in what order. Particularly useful before printing or exporting data.
Charts
Section titled “Charts”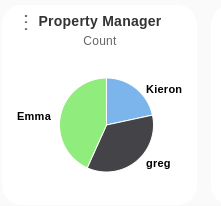
We like to use charts to help you to visualise information. This is an example of a pie chart. The chart is showing the number of requests, by property manager. You can click on the green section to only see requests for Emma’s Owners’ Management Companies. Click on the blue section, to see the requests for Kieron.
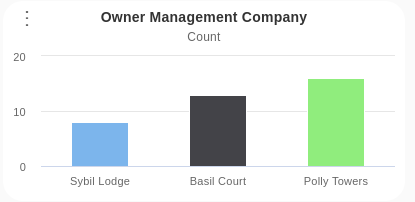
The charts can be customised. You can click on  and choose to change the chart from a pie chart to a bar chart, or to analyse the data based on a different field.
The query bar
Section titled “The query bar”
The query bar allows you to search for data. For each view, you can see here the fields that are being queried. In the example show here, from the “My Requests View”, it is showing the requests for a user logged in as “Greg”, you can click on the list and choose to filter the data for another user. The field “Status” is also shown, which is filtered to only show “Open” items, if you wanted to filter for resolved items, you could change this entry.
In addition to the fields that are filtered in the current view, we also display the fields we think you are most likely to want to search on in this view. In the example shown, you may want to enter a keyword to search for or restrict the list to a specific Owners’ Management Company. The system attempts to make every field queryable. You can click on the

Tables & Sorting
Section titled “Tables & Sorting”Data can usually be easily sorted in tables by clicking on the table header. For example, to sort item by reference :-
- Click once

- Click again to sort descending

- Clicking for a third time will remove the sort

The most common columns you want to see should be shown by default, but you can use the settings button to adjust which columns are shown. Note - If you are querying on a column, e.g. requests that are open, then there is no point wasting screen space displaying “Open” for every item. If you remove the query, then the column will automatically be added back into your display.
Tables & Pagination
Section titled “Tables & Pagination”In order to make sure the system is fast, we may not display all of the data in a list. If there is a lot of data being returned by the current query, we will break that up into “pages” of data. You can use the pagination icons, to move to the next or previous page, move to the first or last page or jump to any particular page.

In the bottom left, you can see the total number of items retrieved, and adjust the page size if you like.

Viewing details
Section titled “Viewing details”If you have permissions to view the details of an item, clicking anywhere on the table row will bring you to the details of the item. If there are hyperlinks or buttons shown on the table, clicking on those will have special functions, but by default clicking anywhere else will bring you to the details.